Use the Aspire dashboard with Python apps
Dette indhold er ikke tilgængeligt i dit sprog endnu.
The Aspire dashboard provides a great user experience for viewing telemetry, and is available as a standalone container image that can be used with any OpenTelemetry-enabled app. In this article, you’ll learn how to:
- Start the Aspire dashboard in standalone mode.
- Use the Aspire dashboard with a Python app.
Prerequisites
Section titled “Prerequisites”To complete this tutorial, you need the following:
- Container runtime.
- You can use an alternative container runtime, but the commands in this article are for Docker.
- Aspire 13.0 or later installed.
- Python 3.10 or higher with uv installed.
Create a sample application
Section titled “Create a sample application”This tutorial uses the Aspire 13.0 Python starter template which includes a FastAPI backend and React frontend. You’ll focus on the FastAPI app to demonstrate dashboard integration with standalone mode.
-
Create a new Aspire solution from the Python starter template:
Create a new Aspire Python solution aspire new aspire-py-starter -n aspire-dashboard-sample -o aspire-dashboard-sample -
Navigate to the application folder:
Change directory cd aspire-dashboard-sample/app -
Review the generated FastAPI application structure. The template includes:
.dockerignoreCommon Docker ignore patterns.python-versionPython version specificationmain.pyFastAPI app with basic endpointspyproject.tomlPython dependenciestelemetry.pyBasic telemetry configuration
-
The starter template already has basic dependencies. Install them:
Install dependencies with uv uv sync
Start the Aspire dashboard
Section titled “Start the Aspire dashboard”Before running the Python app, start the Aspire dashboard in standalone mode so it’s ready to receive telemetry data:
docker run --rm -it -p 18888:18888 -p 4317:18889 --name aspire-dashboard \ mcr.microsoft.com/dotnet/aspire-dashboard:latestIn the Docker logs, the endpoint and key for the dashboard are displayed. Copy the key and navigate to http://localhost:18888 in a web browser. Enter the key to log in to the dashboard.
Leave the dashboard running and open a new terminal for the next steps.
Enhance OpenTelemetry configuration
Section titled “Enhance OpenTelemetry configuration”The starter template includes basic telemetry configuration in telemetry.py. Let’s enhance it to work with the standalone Aspire dashboard.
-
Install additional OpenTelemetry packages for better instrumentation:
Install OpenTelemetry packages uv add opentelemetry-instrumentation-fastapi opentelemetry-instrumentation-httpx -
Update the
telemetry.pyfile to configure OpenTelemetry to send data to the dashboard:Python — app/telemetry.py import loggingimport osfrom opentelemetry import metrics, tracefrom opentelemetry._logs import set_logger_providerfrom opentelemetry.exporter.otlp.proto.grpc._log_exporter import OTLPLogExporterfrom opentelemetry.exporter.otlp.proto.grpc.metric_exporter import OTLPMetricExporterfrom opentelemetry.exporter.otlp.proto.grpc.trace_exporter import OTLPSpanExporterfrom opentelemetry.sdk._logs import LoggerProvider, LoggingHandlerfrom opentelemetry.sdk._logs.export import BatchLogRecordProcessorfrom opentelemetry.sdk.metrics import MeterProviderfrom opentelemetry.sdk.metrics.export import PeriodicExportingMetricReaderfrom opentelemetry.sdk.resources import Resourcefrom opentelemetry.sdk.trace import TracerProviderfrom opentelemetry.sdk.trace.export import BatchSpanProcessorfrom opentelemetry.instrumentation.fastapi import FastAPIInstrumentordef configure_telemetry(app, service_name: str = "app"):"""Configure OpenTelemetry for FastAPI application."""# Get OTLP endpoint from environment or use default for standalone dashboardotlp_endpoint = os.getenv("OTEL_EXPORTER_OTLP_ENDPOINT", "http://localhost:4317")# Create resource with service nameresource = Resource.create({"service.name": service_name})# Configure Tracingtrace_provider = TracerProvider(resource=resource)trace_provider.add_span_processor(BatchSpanProcessor(OTLPSpanExporter(endpoint=otlp_endpoint)))trace.set_tracer_provider(trace_provider)# Configure Metricsmetric_reader = PeriodicExportingMetricReader(OTLPMetricExporter(endpoint=otlp_endpoint))meter_provider = MeterProvider(resource=resource, metric_readers=[metric_reader])metrics.set_meter_provider(meter_provider)# Configure Logginglogger_provider = LoggerProvider(resource=resource)logger_provider.add_log_record_processor(BatchLogRecordProcessor(OTLPLogExporter(endpoint=otlp_endpoint)))set_logger_provider(logger_provider)# Add logging handlerhandler = LoggingHandler(level=logging.NOTSET, logger_provider=logger_provider)logging.getLogger().addHandler(handler)# Instrument FastAPI applicationFastAPIInstrumentor.instrument_app(app)return trace.get_tracer(__name__) -
Update
main.pyto use the enhanced telemetry configuration. Replace the entire file content with the following code, which includes the telemetry setup and example endpoints:Python — app/main.py import loggingfrom fastapi import FastAPIfrom telemetry import configure_telemetrylogging.basicConfig(level=logging.INFO)app = FastAPI()# Configure telemetry for standalone dashboardtracer = configure_telemetry(app, service_name="weather-api")logger = logging.getLogger(__name__)# Example endpoints (replace or extend these based on your application needs)@app.get("/")async def root():logger.info("Root endpoint called")return {"message": "Hello from FastAPI with Aspire dashboard!"}@app.get("/health")async def health():logger.info("Health check called")return {"status": "healthy"}@app.get("/simulate-error")async def simulate_error():logger.warning("This is a simulated warning.")logger.error("This is a simulated error.")return {"message": "Simulated warning and error logs generated"} -
Run the FastAPI application (note: without
--reloadto avoid telemetry issues):Terminal window uv run uvicorn main:app --host 127.0.0.1 --port 8000Terminal window uv run uvicorn main:app --host 127.0.0.1 --port 8000 -
Test the application by browsing to
http://localhost:8000andhttp://localhost:8000/healthto generate telemetry data.
View telemetry in the dashboard
Section titled “View telemetry in the dashboard”With both the dashboard and your Python application running, you can now view telemetry data in real-time:
- Navigate to the Aspire dashboard at
http://localhost:18888(if not already open). - Make requests to your FastAPI application:
- Browse to
http://localhost:8000for the root endpoint - Browse to
http://localhost:8000/healthfor the health check - Browse to
http://localhost:8000/simulate-errorto generate warning and error logs
- Browse to
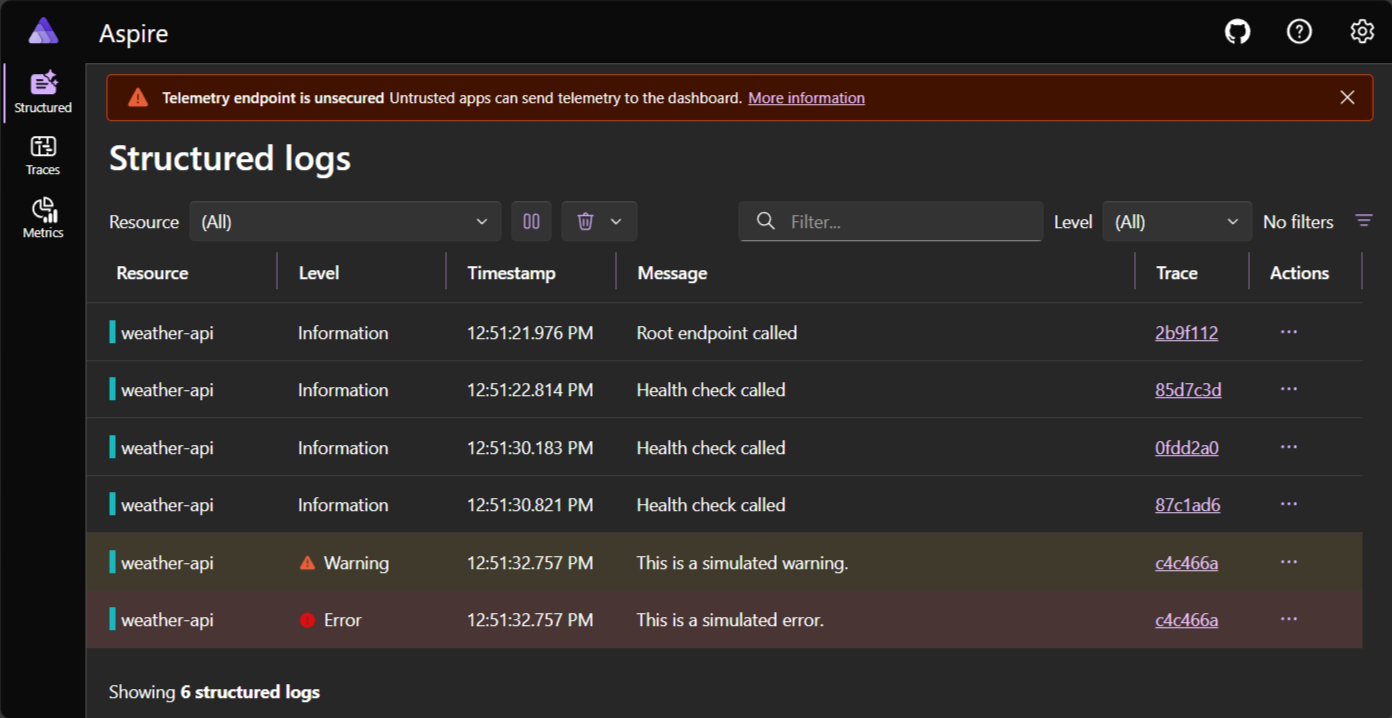
- In the dashboard, explore the different sections:
- Structured Logs: View application logs with filtering and search capabilities
- Traces: See distributed traces for HTTP requests
- Metrics: Monitor application performance metrics
The structured logs page displays logs from your application with rich filtering and search capabilities:
Stop the Python app and dashboard
Section titled “Stop the Python app and dashboard”When you’re done exploring the Aspire dashboard with your Python app, stop both the FastAPI application and the dashboard:
- Stop the FastAPI application by pressing
⌘+C ⌘+C Control + C CtrlC Control + C CtrlC in the terminal where it’s running. - Stop the Aspire dashboard by pressing
CommandsåPlus SignsåC ⌘ + C Control + C CtrlC Control + C CtrlC in the terminal where the Docker container is running.
Next steps
Section titled “Next steps”You have successfully used the Aspire dashboard with a Python application. To learn more:
- Aspire dashboard overview - Learn about all dashboard features
- Build your first Aspire app - Create a full-stack Python application with Aspire orchestration
- Deploy your first Aspire app - Deploy your Python application to Azure