Aspire dashboard overview
Questi contenuti non sono ancora disponibili nella tua lingua.
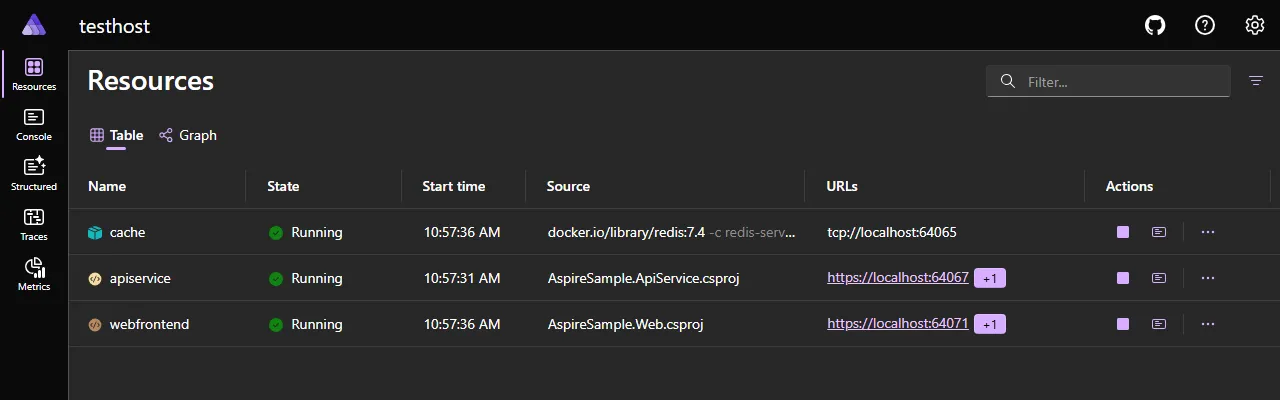
Aspire project templates include a sophisticated dashboard for comprehensive app monitoring and inspection. The dashboard is also available in standalone mode.
The dashboard enables real-time tracking of key aspects of your app, including logs, traces, and environment configurations. It’s designed to enhance the development experience by providing a clear and insightful view of your app’s state and structure.
Key features of the dashboard include:
- Real-time tracking of logs, traces, and environment configurations.
- User interface to stop, start, and restart resources.
- Collects and displays logs and telemetry; view structured logs, traces, and metrics in an intuitive UI.
- Enhanced debugging with GitHub Copilot, your AI-powered assistant built into the dashboard.
Use the dashboard with Aspire projects
Section titled “Use the dashboard with Aspire projects”The dashboard is integrated into the Aspire *.AppHost. During development the dashboard is automatically launched when you start the project. It’s configured to display the Aspire project’s resources and telemetry.
For more information about using the dashboard during Aspire development, see Explore dashboard features.
Standalone mode
Section titled “Standalone mode”The Aspire dashboard is also shipped as a Docker image and can be used standalone, without the rest of Aspire. The standalone dashboard provides a great UI for viewing telemetry and can be used by any application.
docker run --rm -it -p 18888:18888 -p 4317:18889 -d --name aspire-dashboard \ mcr.microsoft.com/dotnet/aspire-dashboard:latestdocker run --rm -it -p 18888:18888 -p 4317:18889 -d --name aspire-dashboard ` mcr.microsoft.com/dotnet/aspire-dashboard:latestThe preceding Docker command:
- Starts a container from the
mcr.microsoft.com/dotnet/aspire-dashboard:latestimage. - The container instance exposing two ports:
- Maps the dashboard’s OTLP port
18889to the host’s port4317. Port4317receives OpenTelemetry data from apps. Apps send data using OpenTelemetry Protocol (OTLP). - Maps the dashboard’s port
18888to the host’s port18888. Port18888has the dashboard UI. Navigate tohttp://localhost:18888in the browser to view the dashboard.
- Maps the dashboard’s OTLP port
For more information, see the Standalone Aspire dashboard.
Configuration
Section titled “Configuration”The dashboard is configured when it starts up. Configuration includes frontend and OTLP addresses, the resource service endpoint, authentication, telemetry limits and more.
For more information, see Aspire dashboard configuration.
Architecture
Section titled “Architecture”The dashboard user experience is built with a variety of technologies. The frontend is built with Grpc.AspNetCore NuGet package to the resource server. Consider the following diagram that illustrates the architecture of the Aspire dashboard:

Security
Section titled “Security”The Aspire dashboard offers powerful insights to your apps. The UI displays information about resources, including their configuration, console logs and in-depth telemetry.
Data displayed in the dashboard can be sensitive. For example, configuration can include secrets in environment variables, and telemetry can include sensitive runtime data. Care should be taken to secure access to the dashboard.
For more information, see Aspire dashboard security considerations.