


Standalone Aspire dashboard as an OTLP viewer
Run the Aspire dashboard as a standalone OTLP viewer to inspect local application logs, distributed traces, and metrics without an AppHost. Keep your existing application startup workflow, including Docker Compose, and configure your apps to export OpenTelemetry to the dashboard.
You can start the dashboard in two ways:
- Use the Aspire CLI to start the dashboard with default local endpoints.
- Use the standalone dashboard container image when you want to run it with Docker or another OCI-compliant container runtime.
Both options receive telemetry from OpenTelemetry-enabled apps. Instrumentation and export configuration are required in each application; starting the dashboard doesn’t instrument your code. For language-specific setup, see Python telemetry or JavaScript and Node.js telemetry.
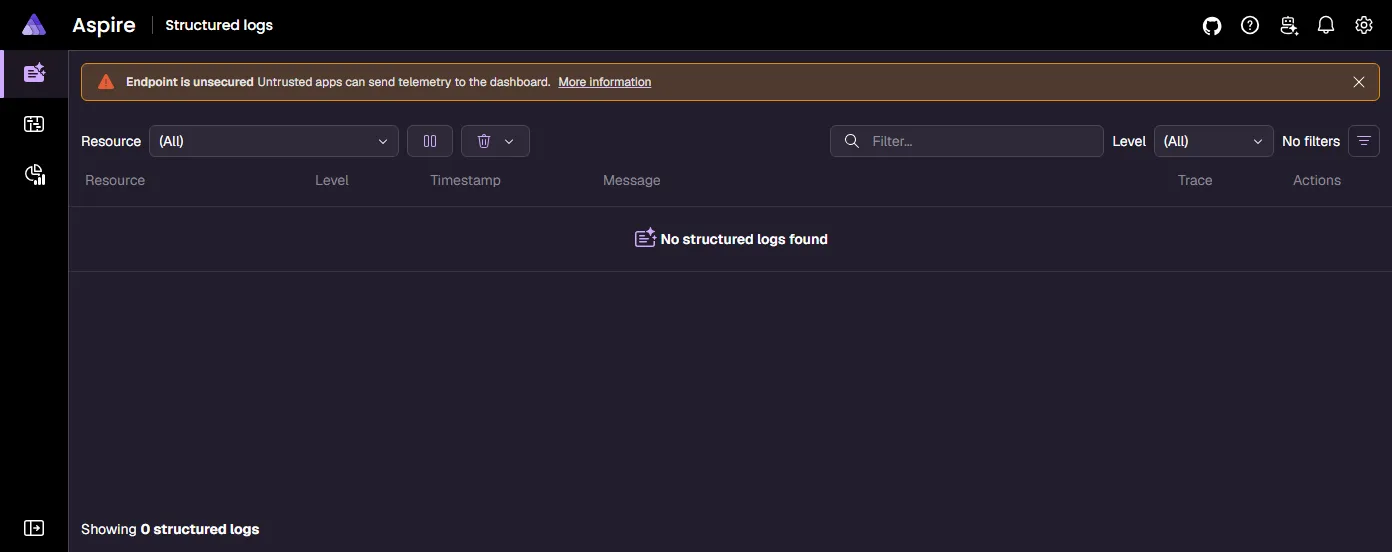
Start the dashboard
Section titled “Start the dashboard”Choose the startup path that best fits your workflow. The Aspire CLI provides the shortest local setup, while the container image works well when you already manage tools through a container runtime.
Aspire CLI
Section titled “Aspire CLI”The quickest way to start the standalone dashboard is to use the Aspire CLI via npx.
The npx command is a package runner included with Node.js.
To run the Aspire CLI package with npx:
npx -y @microsoft/aspire-cli dashboard runOr install the Aspire CLI, then start the dashboard:
aspire dashboard runThe dashboard starts with the following defaults:
- Frontend UI at
http://localhost:18888 - OTLP/gRPC endpoint at
http://localhost:4317 - OTLP/HTTP endpoint at
http://localhost:4318
The dashboard is secured with a browser token by default. A login URL with the token is displayed in the terminal output. Use --allow-anonymous to disable authentication during local development. For the security implications, see Dashboard security considerations.
For all available options, see the aspire dashboard run command reference.
Container image
Section titled “Container image”The dashboard also ships as a standalone container image. Use this option when a container workflow fits your environment or you want to manage dashboard hosting with your existing container tooling.
docker run --rm -it -p 18888:18888 -p 4317:18889 -p 4318:18890 -d --name aspire-dashboard \ mcr.microsoft.com/dotnet/aspire-dashboard:latestdocker run --rm -it -p 18888:18888 -p 4317:18889 -p 4318:18890 -d --name aspire-dashboard ` mcr.microsoft.com/dotnet/aspire-dashboard:latestThe preceding Docker command:
- Starts a container from the
mcr.microsoft.com/dotnet/aspire-dashboard:latestimage. - The container exposes three ports:
- Mapping the dashboard’s port
18888to the host’s port18888. Port18888has the dashboard UI. Navigate tohttp://localhost:18888in the browser to view the dashboard. - Mapping the dashboard’s OTLP/gRPC port
18889to the host’s port4317. Port4317receives OpenTelemetry data from apps using OTLP/gRPC. - Mapping the dashboard’s OTLP/HTTP port
18890to the host’s port4318. Port4318receives OpenTelemetry data from apps using OTLP/HTTP.
- Mapping the dashboard’s port
Login to the dashboard
Section titled “Login to the dashboard”Data displayed in the dashboard can be sensitive. By default, the dashboard is secured with authentication that requires a token to login.
When the dashboard is run with aspire dashboard run, the Aspire CLI prints the login URL directly in the terminal. Open that URL in your browser to log in.
When the dashboard is run from a standalone container, the login token is printed to the container logs. The logs are displayed in the Docker Desktop user interface on the Logs tab for the aspire-dashboard container:
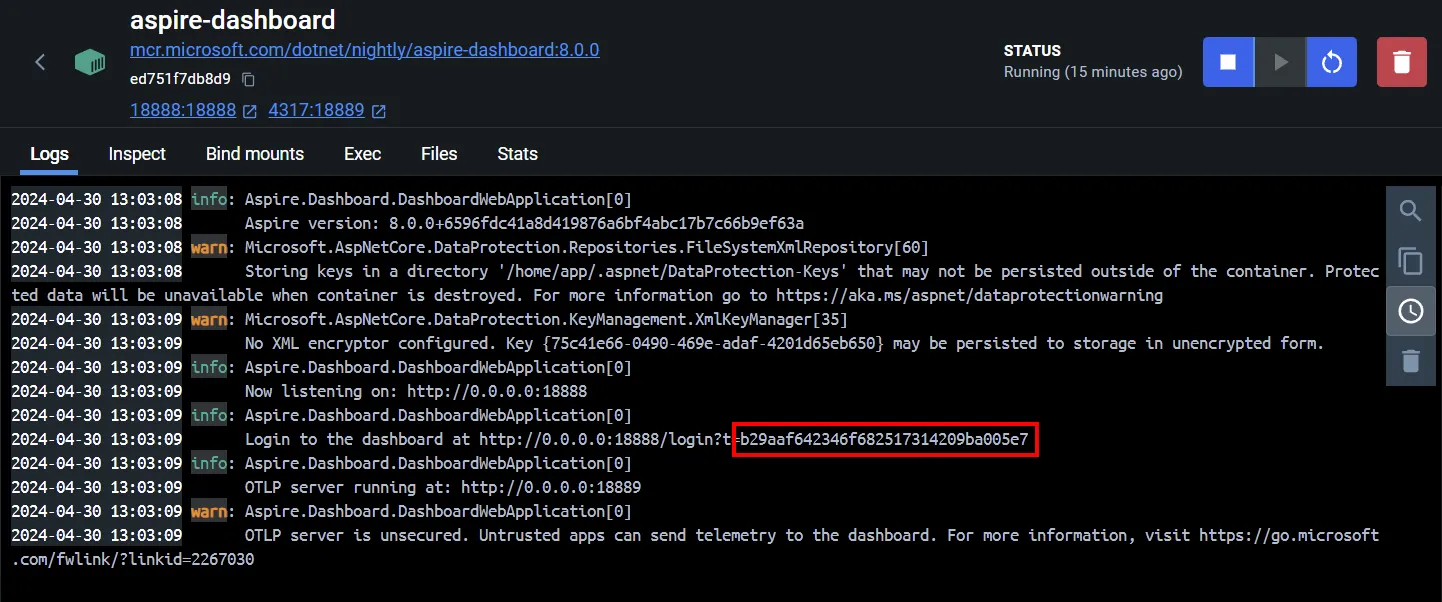
After copying the highlighted token into the login page, select the Login button.
Alternatively, you can obtain the token from the logs by using the docker command:
#!/bin/bashloginLine=$(docker container logs aspire-dashboard | grep "login?t=")match=$(echo "$loginLine" | sed -n 's/.*login?t=\([^[:space:]]*\).*/\1/p')echo -n "$match" | xclip -selection clipboardecho "$match"$loginLine = docker container logs aspire-dashboard | Select-String "login\?t="$matches = [regex]::Match($loginLine, "(?<=login\?t=)(\S+)")$matches.Value | Set-Clipboardecho $matches.ValueFor more information about logging into the dashboard, see Dashboard authentication.
Explore the dashboard
Section titled “Explore the dashboard”The dashboard offers a UI for viewing telemetry. Refer to the documentation to explore the telemetry functionality:
Although there is no restriction on where the dashboard is run, the dashboard is designed as a development and short-term diagnostic tool. The dashboard persists telemetry in-memory which creates some limitations:
- Telemetry is automatically removed if telemetry limits are exceeded.
- No telemetry is persisted when the dashboard is restarted.
Unavailable features when standalone
Section titled “Unavailable features when standalone”Telemetry service names aren’t AppHost-managed resources. In standalone mode, the dashboard doesn’t provide process health, console output capture, or start/stop/restart controls through the resources UI. To enable those resource features, configure a resource service.
AI coding agents can still use the standalone dashboard via the Aspire CLI and MCP server. See Dashboard and AI coding agents for details.
Send telemetry to the dashboard
Section titled “Send telemetry to the dashboard”Apps send telemetry to the dashboard using OpenTelemetry Protocol (OTLP). The dashboard must expose a port for receiving OpenTelemetry data, and apps are configured to send data to that address.
Both startup options shown earlier configure the dashboard to receive OpenTelemetry data on port 4317 (gRPC) and port 4318 (HTTP). The OTLP endpoint addresses are http://localhost:4317 for gRPC and http://localhost:4318 for HTTP. The Docker command maps the container’s OTLP ports to the same host ports.
Configure OpenTelemetry SDK
Section titled “Configure OpenTelemetry SDK”Apps collect and send telemetry using their language’s OpenTelemetry SDK.
Important OpenTelemetry SDK options to configure:
- OTLP endpoint, which should match the dashboard’s configuration, for example,
http://localhost:4317for gRPC orhttp://localhost:4318for HTTP. - OTLP protocol. The dashboard supports all OTLP protocols:
To configure applications:
- Use the OpenTelemetry SDK APIs within the application, or
- Start the app with known environment variables:
OTEL_EXPORTER_OTLP_PROTOCOLwith a value ofgrpc,http/protobuf, orhttp/json.OTEL_EXPORTER_OTLP_ENDPOINTwith a value ofhttp://localhost:4317for gRPC orhttp://localhost:4318for HTTP.
Query telemetry with the Aspire CLI
Section titled “Query telemetry with the Aspire CLI”The Aspire CLI can query telemetry data directly from the dashboard’s API, allowing you to view logs, traces, and spans from the terminal without opening the dashboard UI.
The dashboard’s telemetry API is secured with API key authentication by default. When using the CLI commands, you can pass the dashboard’s login URL (including the browser token) via --dashboard-url and the token is automatically exchanged for an API key. Alternatively, if the dashboard is started with aspire dashboard run --allow-anonymous or the ASPIRE_DASHBOARD_UNSECURED_ALLOW_ANONYMOUS environment variable is set to true, no authentication is required. See Dashboard security considerations for the security implications.
View telemetry with aspire otel
Section titled “View telemetry with aspire otel”The aspire otel commands retrieve telemetry from the dashboard. Use --dashboard-url to point at a standalone dashboard — you can paste the full login URL and the browser token is automatically exchanged for an API key:
aspire otel logs --dashboard-url "http://localhost:18888/login?t=<token>"aspire otel traces --dashboard-url "http://localhost:18888/login?t=<token>"aspire otel spans --dashboard-url "http://localhost:18888/login?t=<token>"For more details, see the aspire otel logs, aspire otel traces, and aspire otel spans command references.
Use AI agents with aspire agent mcp
Section titled “Use AI agents with aspire agent mcp”The aspire agent mcp command starts an MCP (Model Context Protocol) server that AI assistants can connect to. When used with --dashboard-url, it runs in dashboard-only mode and exposes telemetry tools (structured logs and traces) to MCP-compatible clients:
Unlike aspire otel, the MCP command doesn’t exchange the browser token from a login URL. Start the dashboard with an explicit telemetry API key:
aspire dashboard run --Dashboard:Api:AuthMode=ApiKey --Dashboard:Api:PrimaryApiKey="<api-key>"Then start the MCP server in a separate terminal with the dashboard base URL and the same key:
aspire agent mcp --dashboard-url "http://localhost:18888" --api-key "<api-key>"Use a high-entropy key and don’t commit or share it. For more information, see Secure the telemetry API endpoint.
Sample
Section titled “Sample”For a sample of using the standalone dashboard, see the Standalone Aspire dashboard sample app.
 Aspire