


Aspire dashboard for distributed apps
Your app, at a glance. Fully observable.
Real-time visibility into every resource, log, trace, and metric in your distributed app — right from your dev environment.
Built on OpenTelemetry
Section titled “Built on OpenTelemetry”The Aspire Dashboard is your command center during development. Powered by OpenTelemetry — the industry-standard observability framework — it automatically collects traces, metrics, and structured logs from every resource in your AppHost using OTLP (OpenTelemetry Protocol) and surfaces them through a rich, interactive UI. No vendor lock-in, no proprietary agents — just open standards.
Resources at your fingertips
See the health, endpoints, and state of every service, container, and project in your application at a glance. Start, stop, and restart resources directly from the dashboard.
Explore the resources page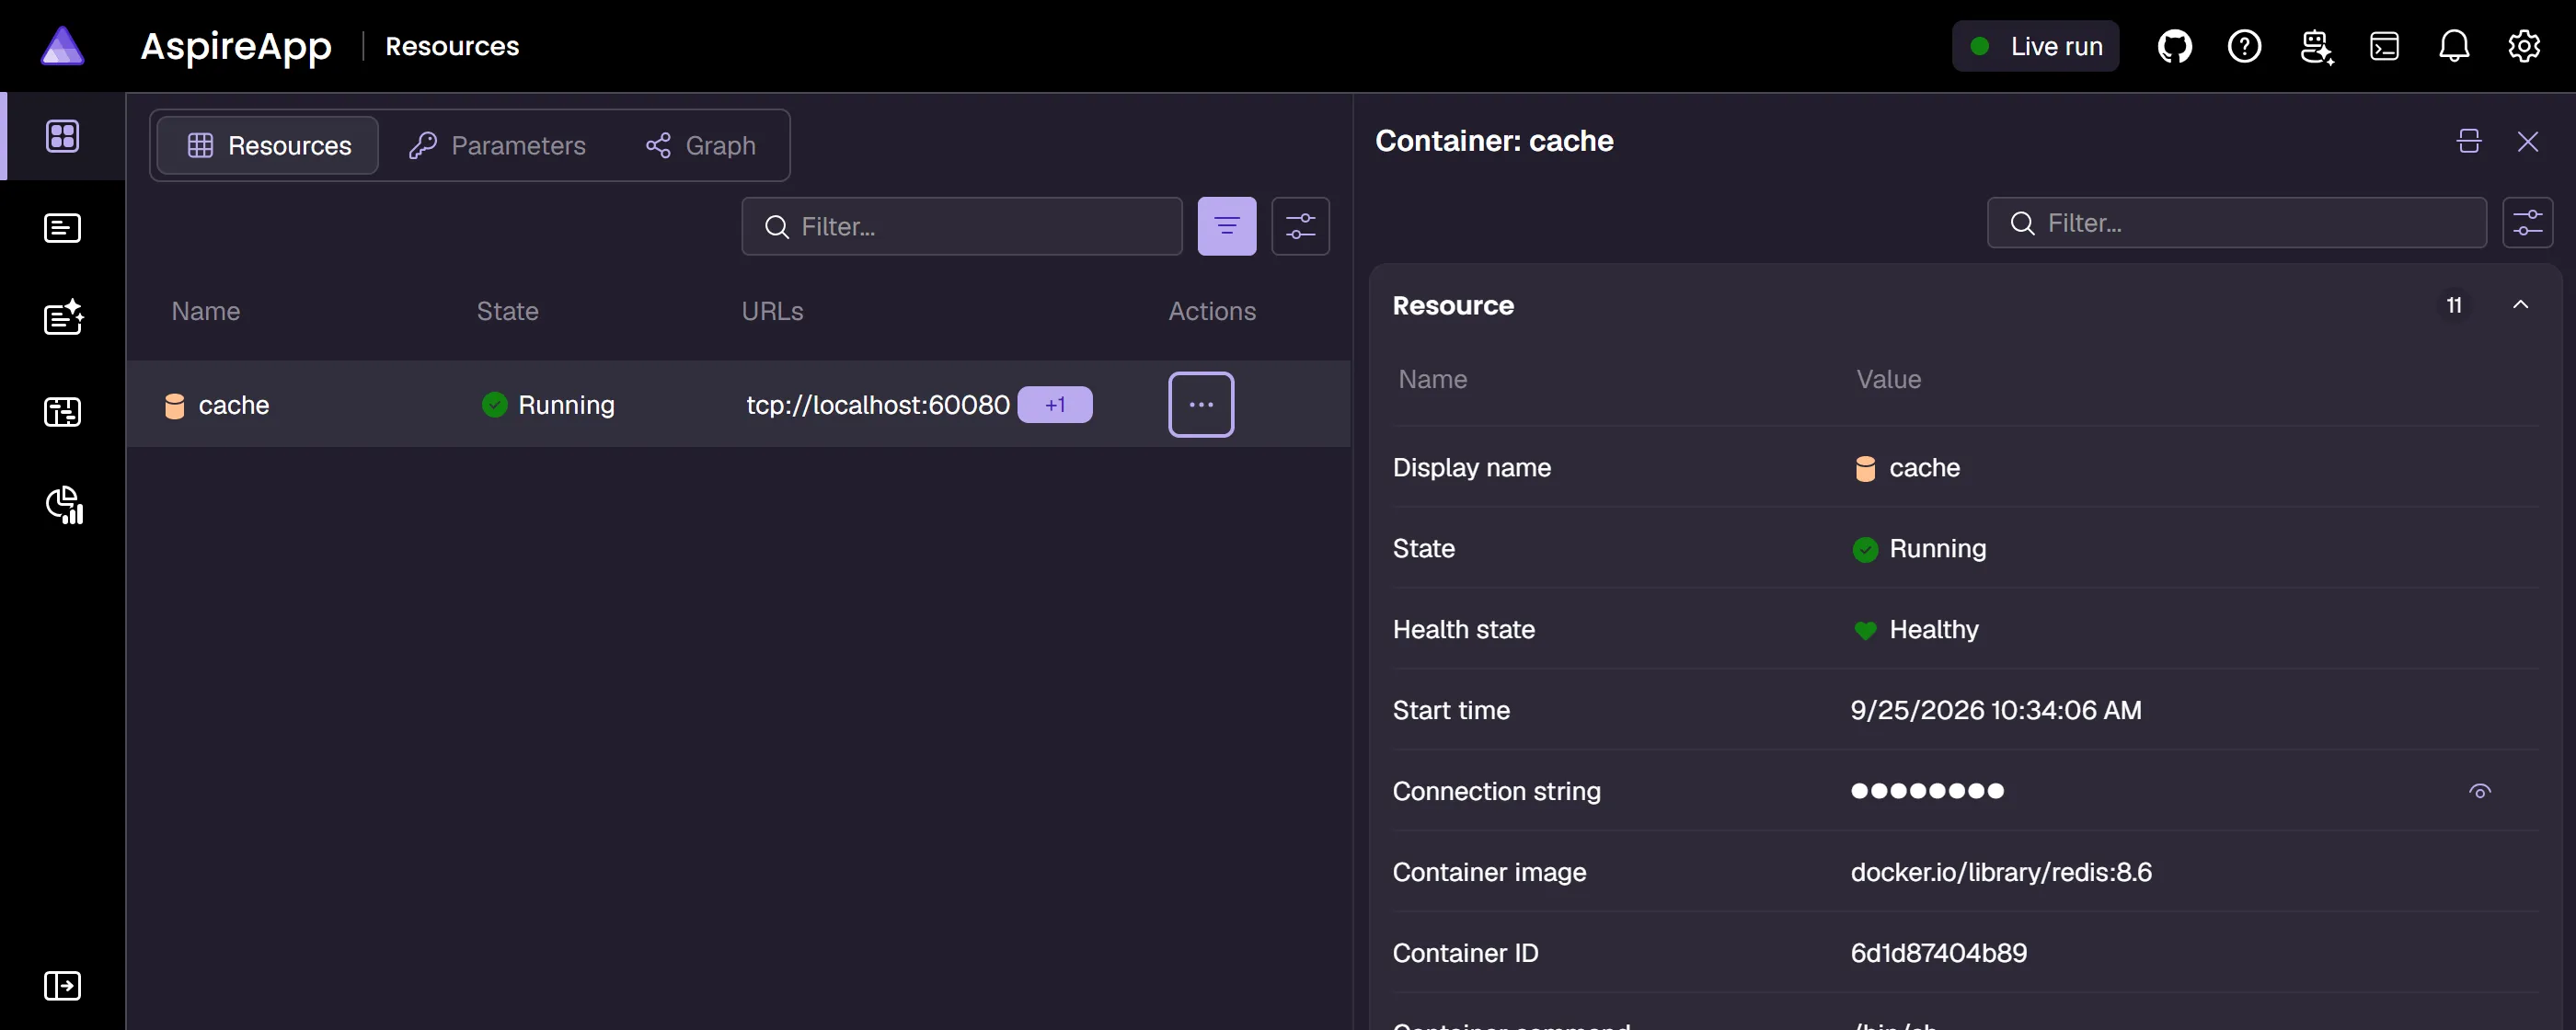
Distributed traces, demystified
Follow requests across service boundaries with detailed span-level traces. Quickly identify bottlenecks, errors, and latency issues in your distributed application.
Learn about tracing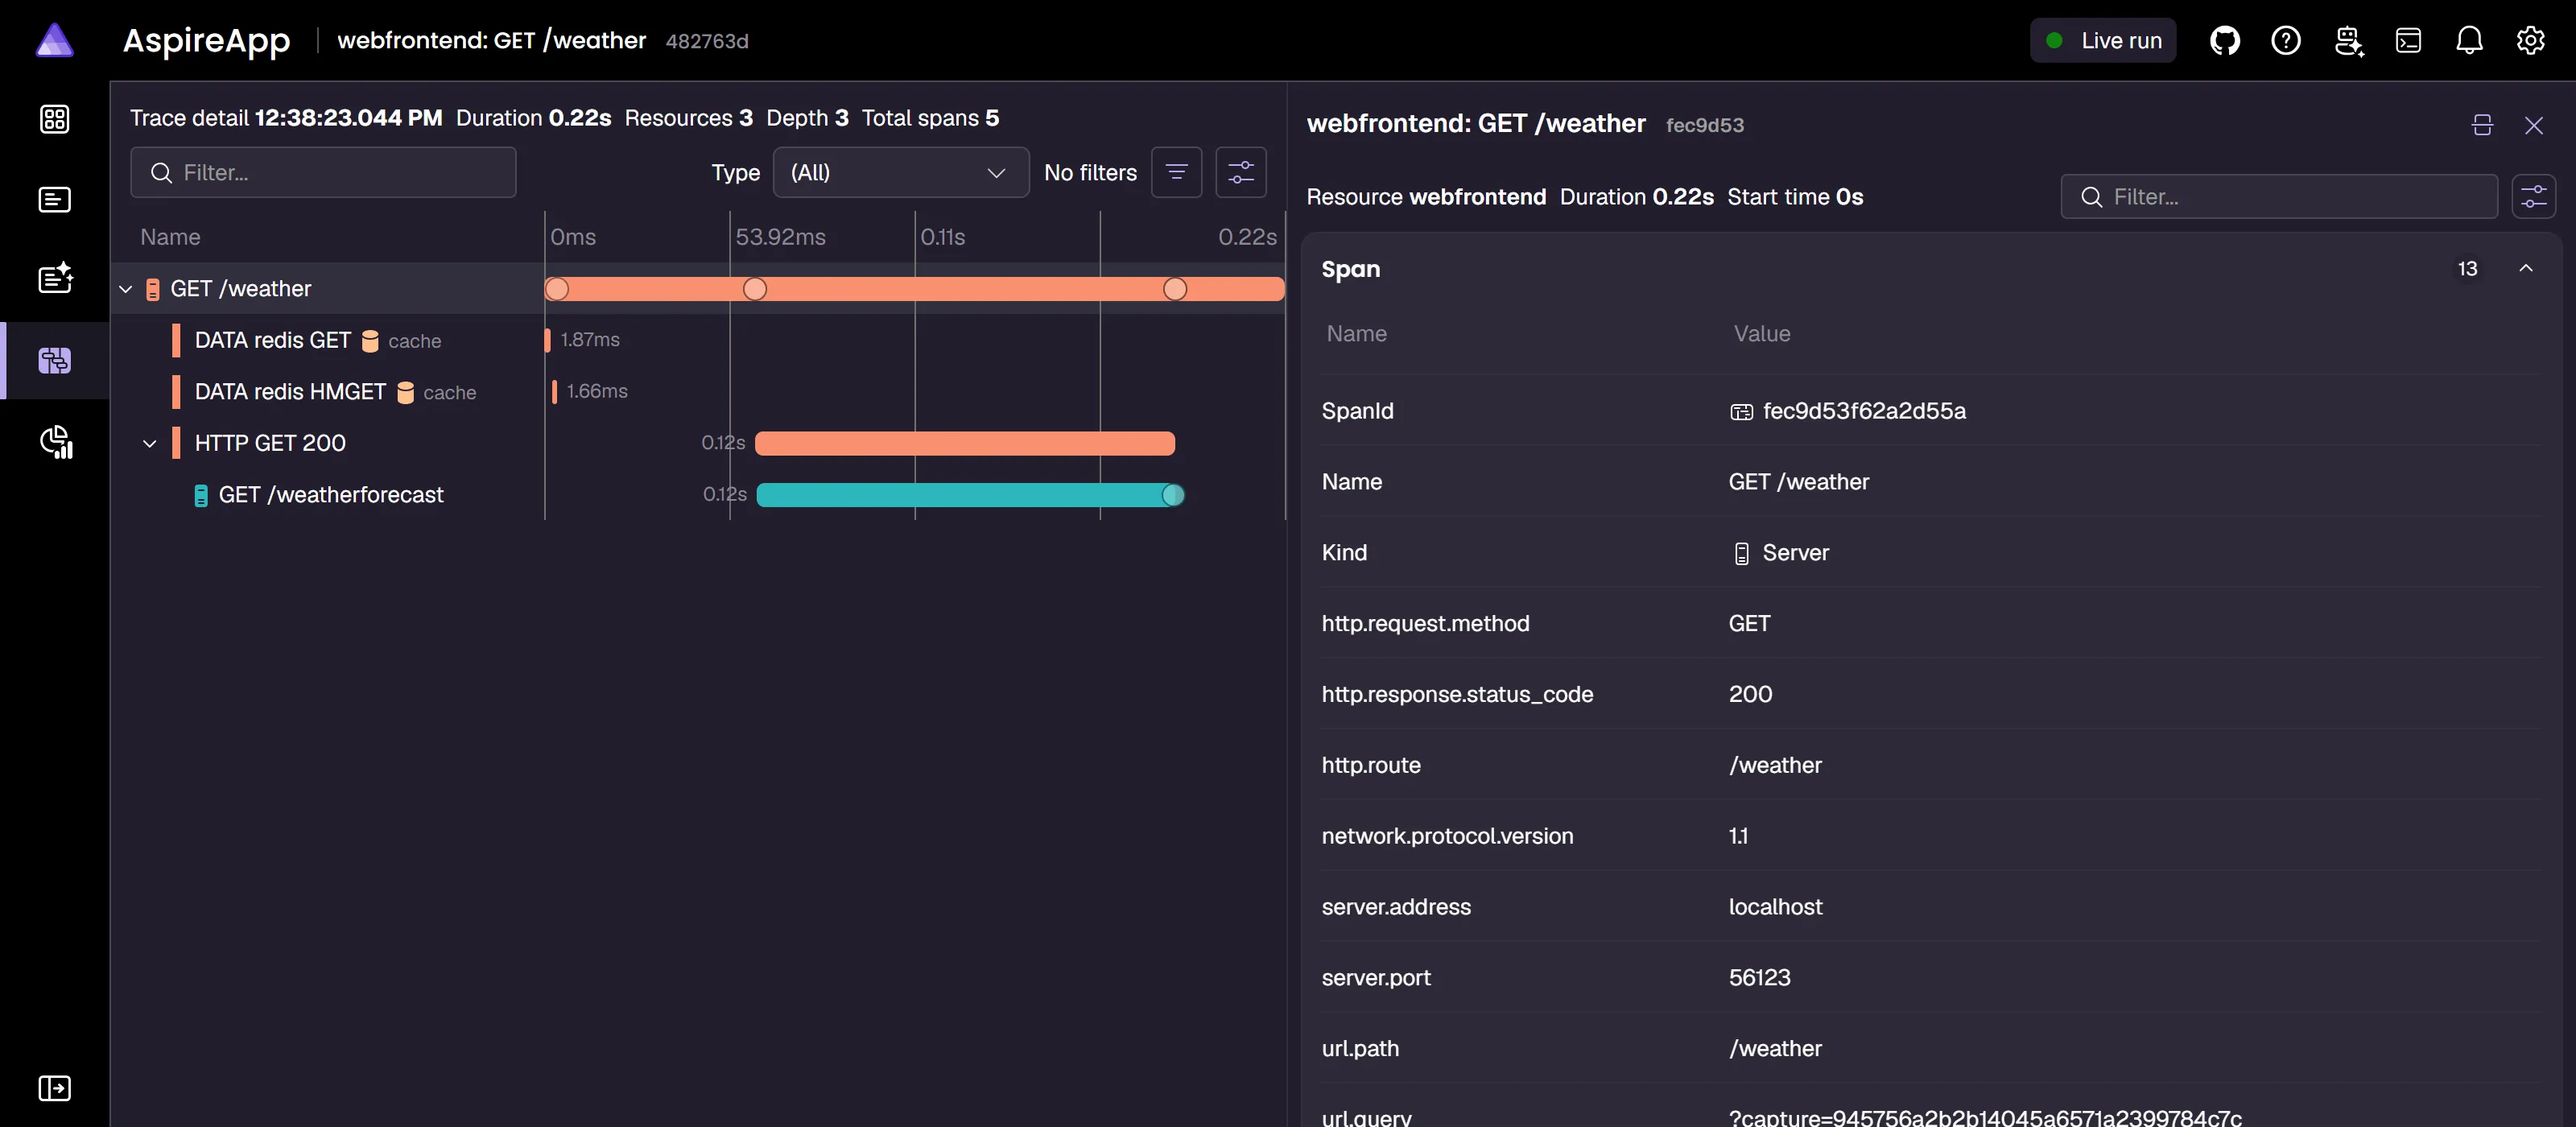
Structured logs with context
Structured logs are automatically collected and enriched with resource context. Filter by severity, resource, or trace to find exactly what you need.
View log features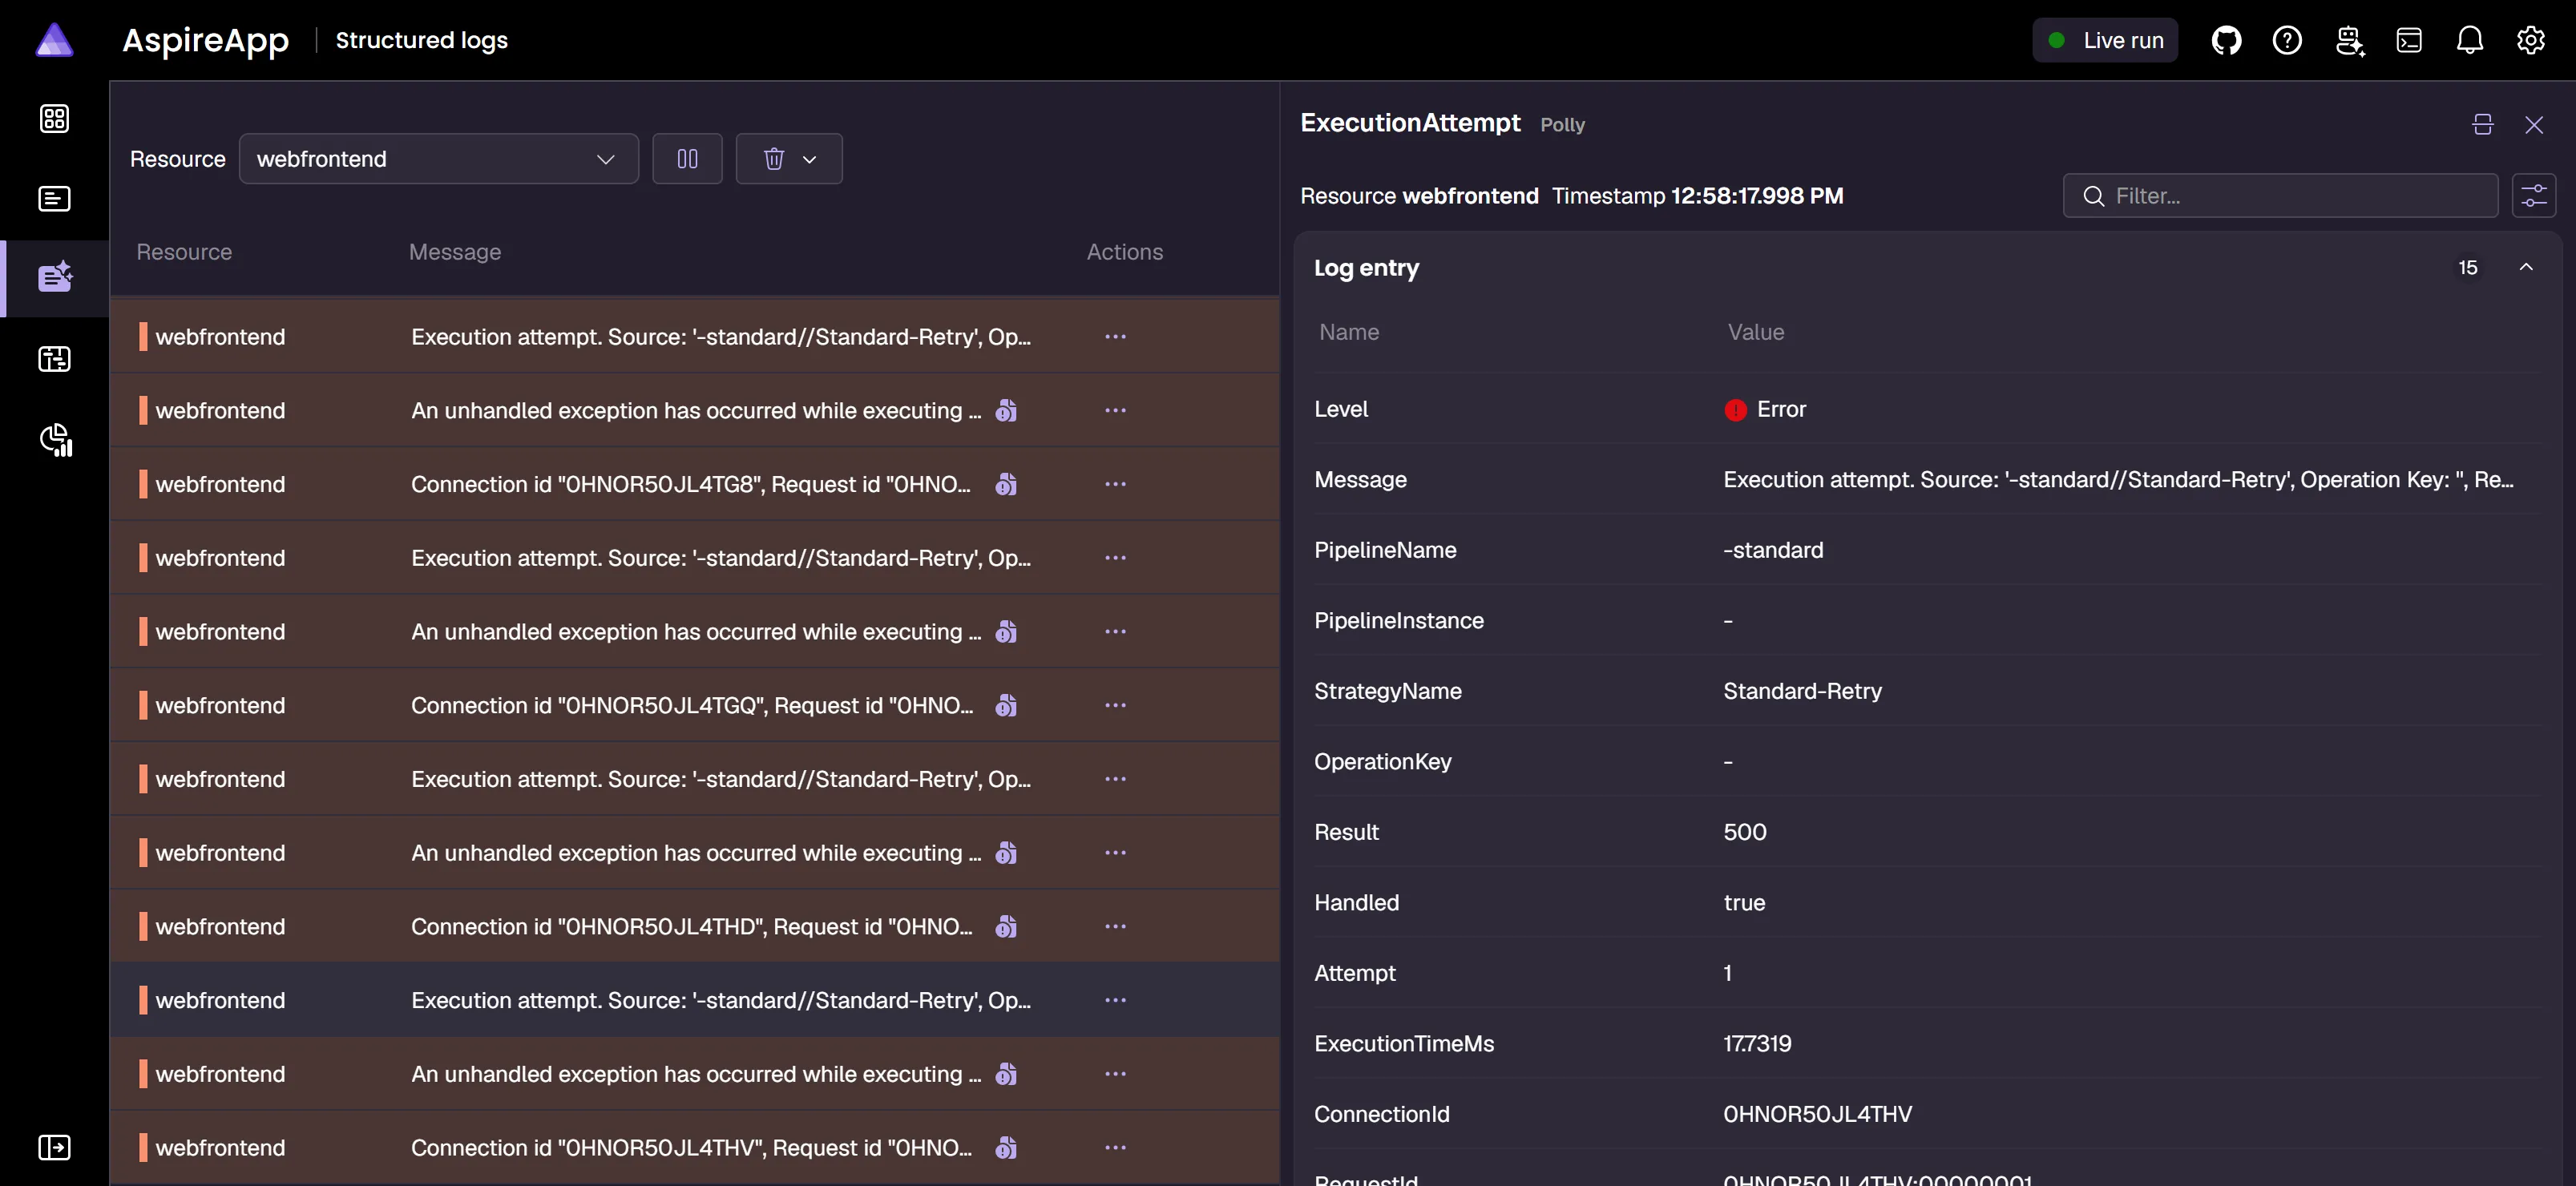
Run the dashboard standalone
Section titled “Run the dashboard standalone”The dashboard starts automatically with your Aspire app, but it can also run standalone to monitor any application that sends OpenTelemetry data.
Install the Aspire CLI, then start the dashboard:
aspire dashboard runOr run the same standalone dashboard from its container image:
docker run --rm -it -p 18888:18888 -p 4317:18889 -p 4318:18890 -d --name aspire-dashboard \ mcr.microsoft.com/aspire/dashboard:latestdocker run --rm -it -p 18888:18888 -p 4317:18889 -p 4318:18890 -d --name aspire-dashboard ` mcr.microsoft.com/aspire/dashboard:latestOpen the dashboard URL, then point your apps’ OTLP exporter to http://localhost:4317. For prerequisites, login details, and additional options, see the standalone dashboard guide.
AI-powered debugging
Section titled “AI-powered debugging”AI agents with dashboard context
Give AI coding agents deep observability into resource state, health checks, logs, traces, and relationships so they can diagnose issues and verify fixes with confidence.
Use AI coding agents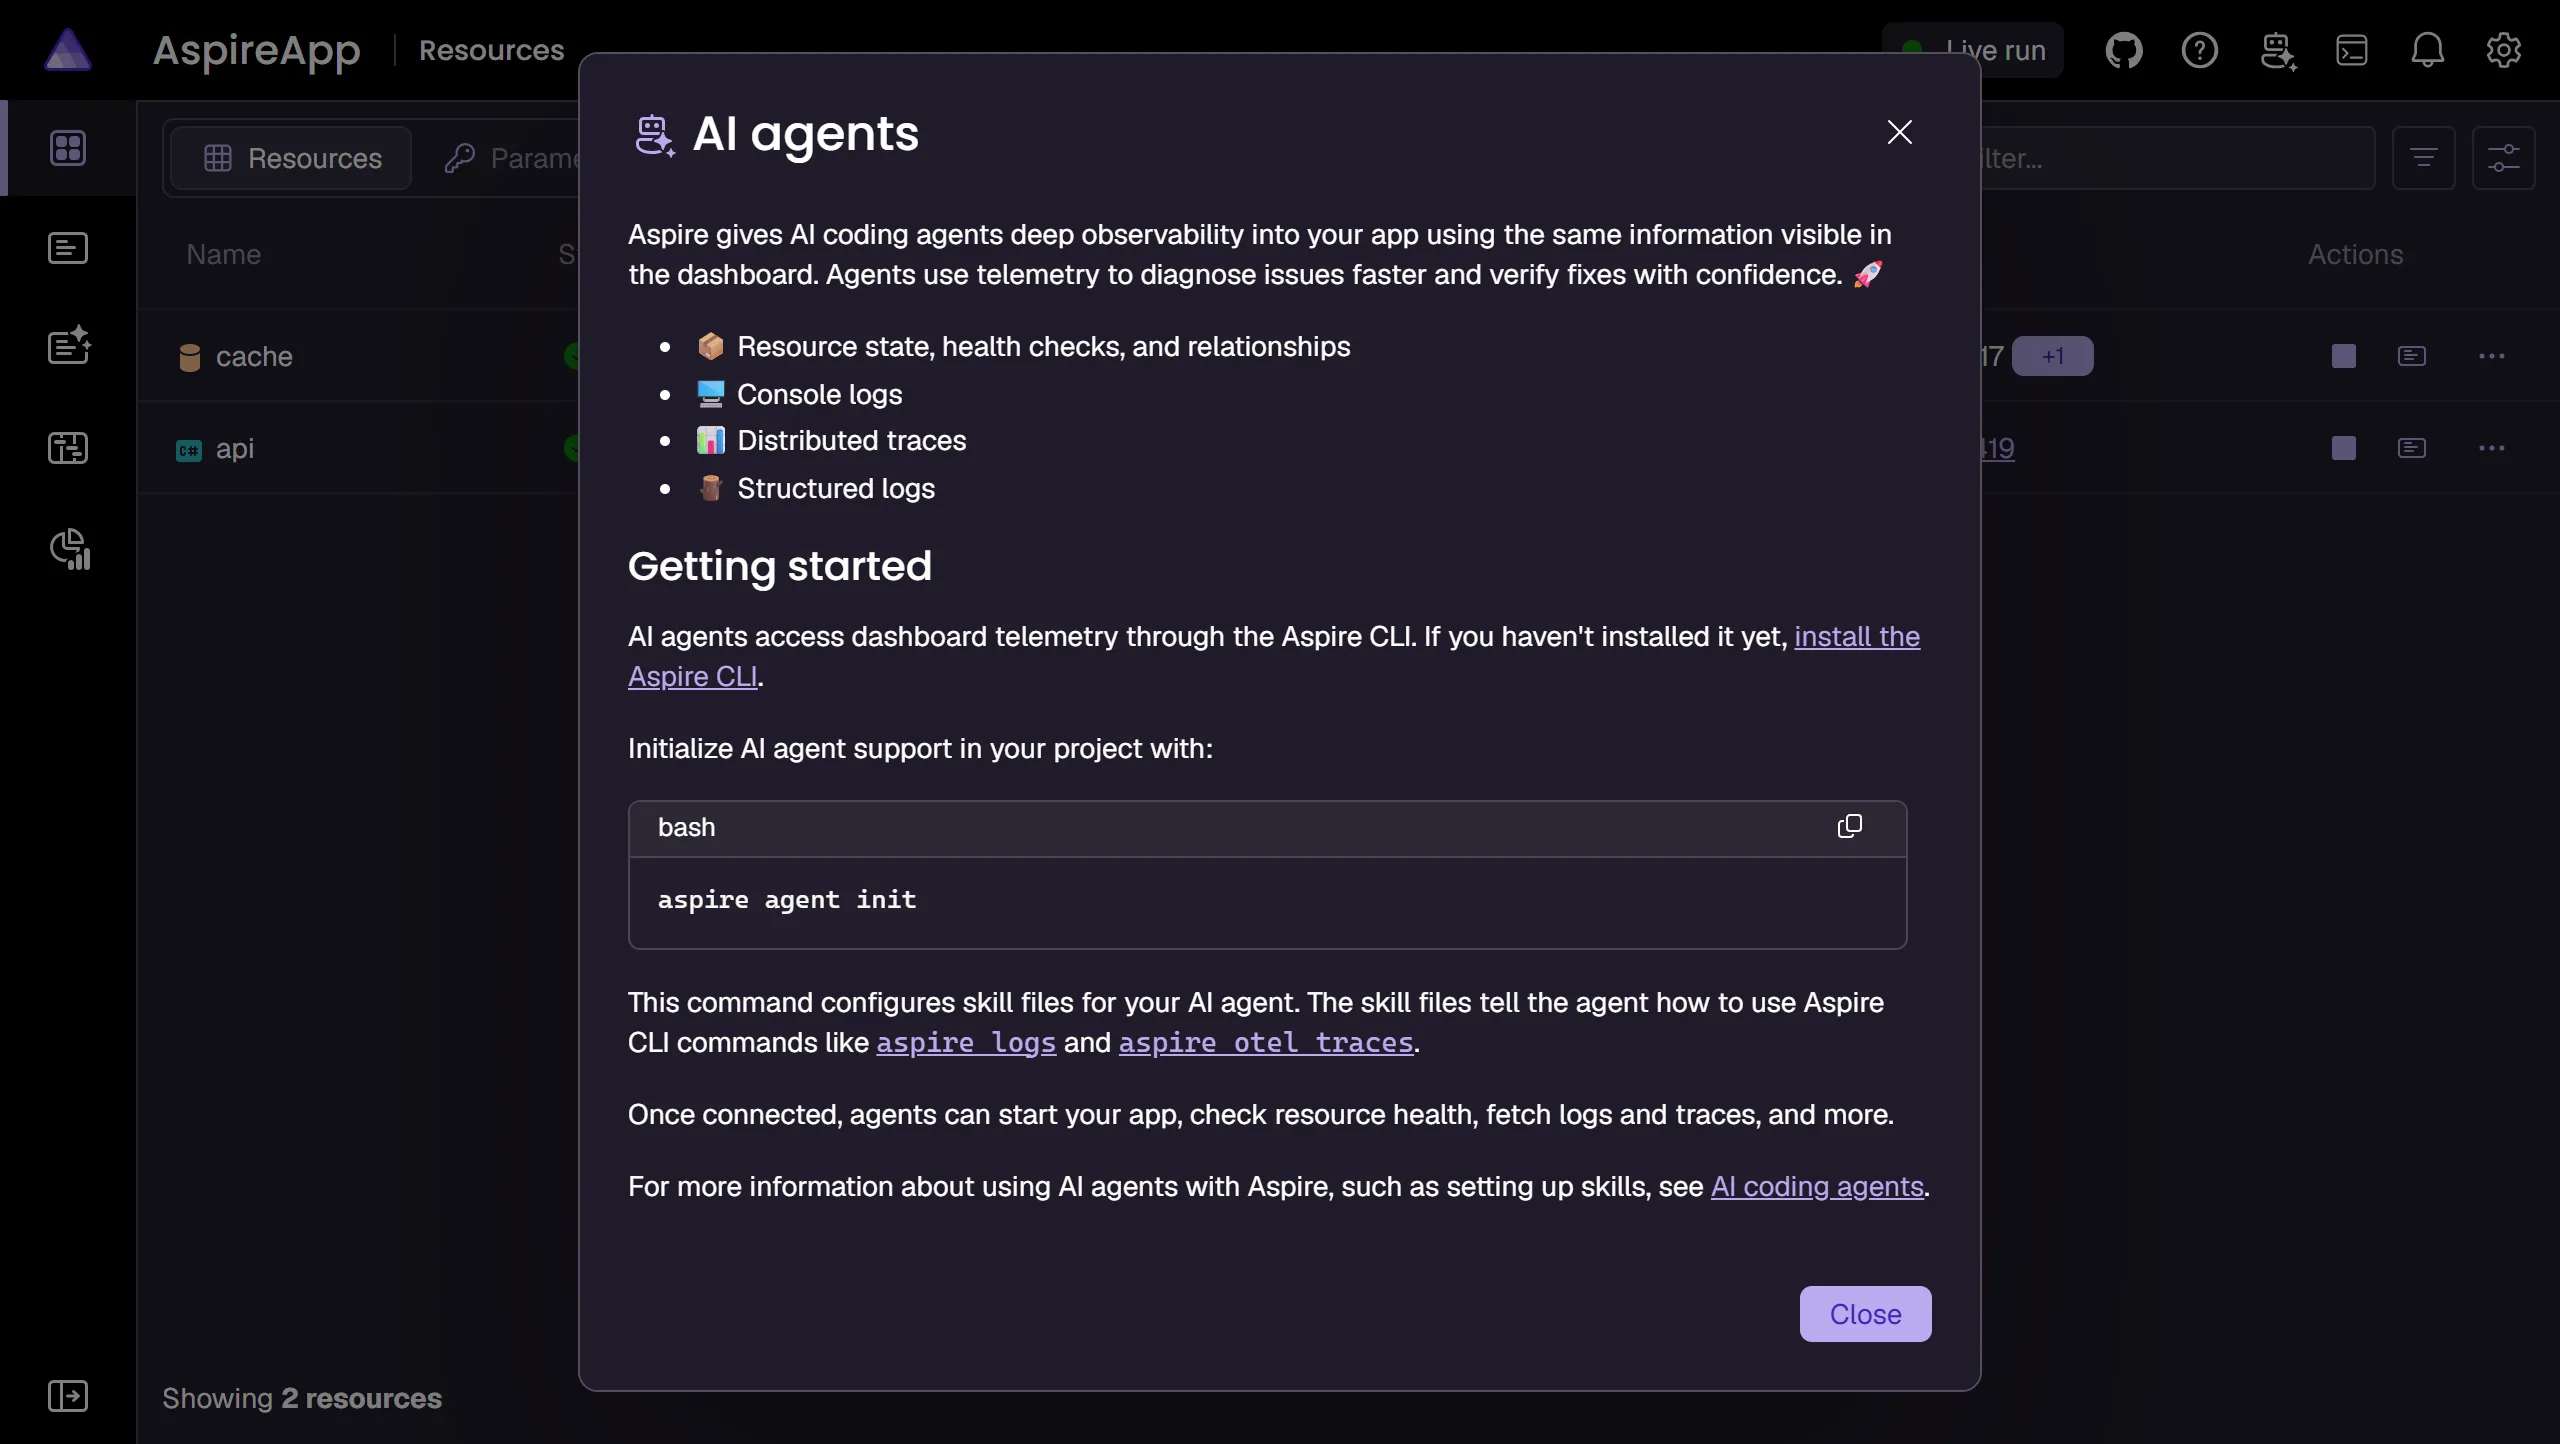
Key capabilities
Section titled “Key capabilities”Resource management
Start, stop, and restart any resource in your application. View endpoints, environment variables, and health status.
Learn moreDistributed tracing
Follow requests across service boundaries with span-level detail. Identify bottlenecks and errors instantly.
Learn moreStructured & console logs
View structured and console logs from every resource with powerful filtering, search, and error highlighting.
Learn moreMetrics & monitoring
Track request counts, error rates, and custom metrics with interactive charts and exemplar linking.
Learn moreOpenTelemetry native
Built on OTLP — the open standard for telemetry. Works with any language or framework that supports OpenTelemetry.
Learn moreStandalone mode
Use the dashboard independently to monitor any application that sends OpenTelemetry data.
Learn moreBeyond development
Section titled “Beyond development”AI coding agents
Use the Aspire CLI and MCP server to give agents dashboard data for diagnosing and verifying app changes.
Use agentsConfiguration
Customize OTLP endpoints, authentication, telemetry limits, and more. The dashboard adapts to your workflow.
View optionsSecurity
Understand security considerations for exposing dashboard data and configure authentication for production scenarios.
Security guideBrowser telemetry
Enable browser-based telemetry collection to capture frontend performance data alongside backend traces.
Enable telemetry Aspire