Standalone Aspire dashboard
Bu içerik henüz dilinizde mevcut değil.
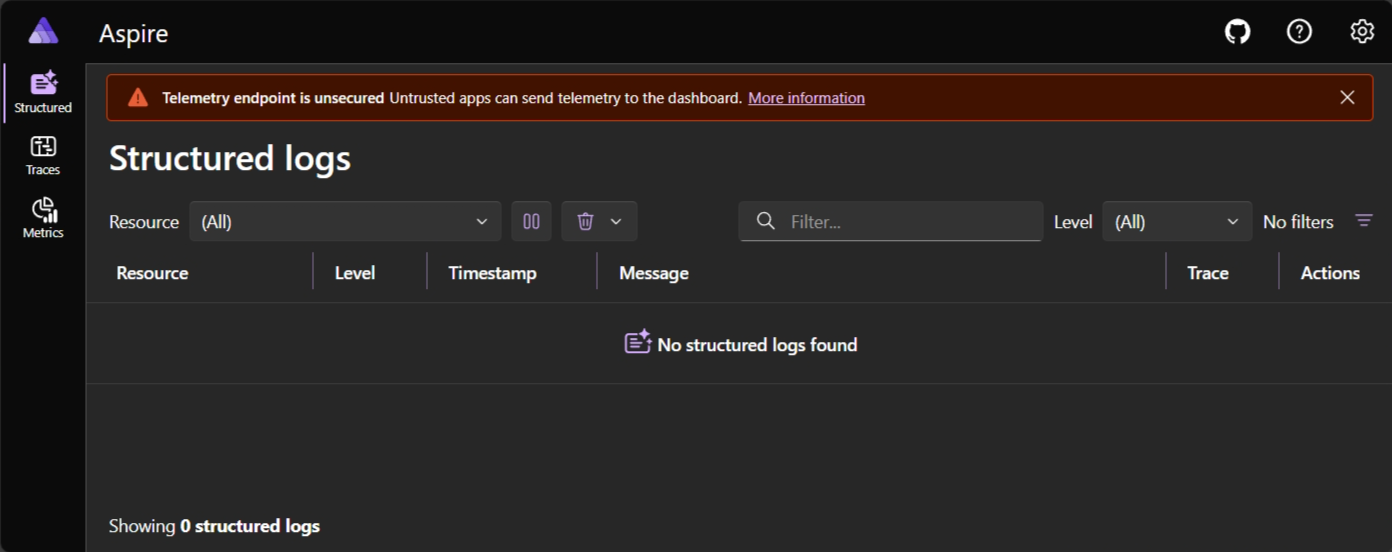
The Aspire dashboard provides a great UI for viewing telemetry. The dashboard:
- Ships as a container image that can be used with any OpenTelemetry enabled app.
- Can be used standalone, without the rest of Aspire.
Start the dashboard
Section titled “Start the dashboard”The dashboard is started using the Docker command line.
docker run --rm -it -d \ -p 18888:18888 \ -p 4317:18889 \ --name aspire-dashboard \ mcr.microsoft.com/dotnet/aspire-dashboard:latestdocker run --rm -it -d ` -p 18888:18888 ` -p 4317:18889 ` --name aspire-dashboard ` mcr.microsoft.com/dotnet/aspire-dashboard:latestThe preceding Docker command:
- Starts a container from the
mcr.microsoft.com/dotnet/aspire-dashboard:latestimage. - The container exposes two ports:
- Mapping the dashboard’s OTLP port
18889to the host’s port4317. Port4317receives OpenTelemetry data from apps. Apps send data using OpenTelemetry Protocol (OTLP). - Mapping the dashboard’s port
18888to the host’s port18888. Port18888has the dashboard UI. Navigate tohttp://localhost:18888in the browser to view the dashboard.
- Mapping the dashboard’s OTLP port
Login to the dashboard
Section titled “Login to the dashboard”Data displayed in the dashboard can be sensitive. By default, the dashboard is secured with authentication that requires a token to login.
When the dashboard is run from a standalone container, the login token is printed to the container logs. The logs are displayed in the Docker Desktop user interface on the Logs tab for the aspire-dashboard container:
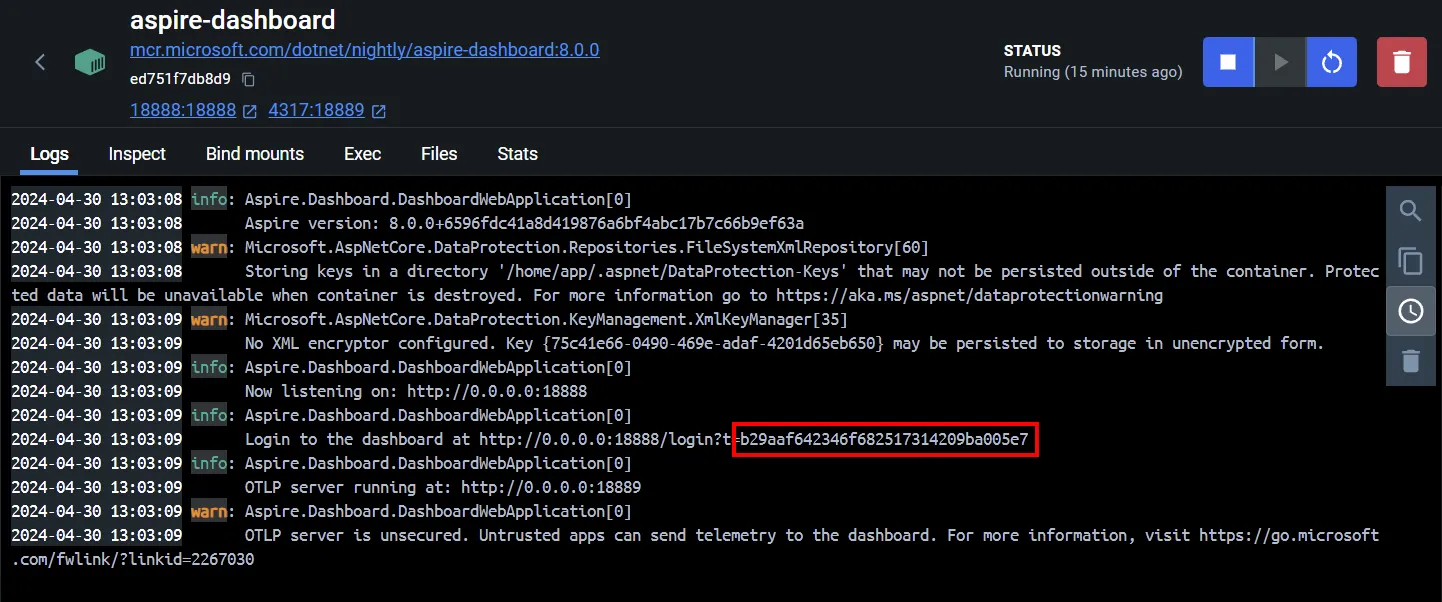
After copying the highlighted token into the login page, select the Login button.
Alternatively, you can obtain the token from the logs by using the docker command:
#!/bin/bashloginLine=$(docker container logs aspire-dashboard | grep "login?t=")match=$(echo "$loginLine" | sed -n 's/.*login?t=\([^[:space:]]*\).*/\1/p')echo -n "$match" | xclip -selection clipboardecho "$match"$loginLine = docker container logs aspire-dashboard | Select-String "login\?t="$matches = [regex]::Match($loginLine, "(?<=login\?t=)(\S+)")$matches.Value | Set-Clipboardecho $matches.ValueFor more information about logging into the dashboard, see Dashboard authentication.
Explore the dashboard
Section titled “Explore the dashboard”The dashboard offers a UI for viewing telemetry. Refer to the documentation to explore the telemetry functionality:
Although there is no restriction on where the dashboard is run, the dashboard is designed as a development and short-term diagnostic tool. The dashboard persists telemetry in-memory which creates some limitations:
- Telemetry is automatically removed if telemetry limits are exceeded.
- No telemetry is persisted when the dashboard is restarted.
Unavailable features when standalone
Section titled “Unavailable features when standalone”The dashboard has functionality for viewing Aspire resources. The dashboard resource features are disabled when it is run in standalone mode. To enable the resources UI, add configuration for a resource service.
GitHub Copilot functionality isn’t available in the standalone dashboard. Copilot uses a connection to your IDE to communicate with GitHub Copilot and that connection isn’t available when the dashboard is in standalone mode.
Send telemetry to the dashboard
Section titled “Send telemetry to the dashboard”Apps send telemetry to the dashboard using OpenTelemetry Protocol (OTLP). The dashboard must expose a port for receiving OpenTelemetry data, and apps are configured to send data to that address.
A Docker command was shown earlier to start the dashboard. It configured the container to receive OpenTelemetry data on port 4317. The OTLP endpoint’s full address is http://localhost:4317.
Configure OpenTelemetry SDK
Section titled “Configure OpenTelemetry SDK”Apps collect and send telemetry using their language’s OpenTelemetry SDK.
Important OpenTelemetry SDK options to configure:
- OTLP endpoint, which should match the dashboard’s configuration, for example,
http://localhost:4317. - OTLP protocol, with the dashboard currently supporting only the OTLP/gRPC protocol. Configure applications to use the
grpcprotocol.
To configure applications:
- Use the OpenTelemetry SDK APIs within the application, or
- Start the app with known environment variables:
OTEL_EXPORTER_OTLP_PROTOCOLwith a value ofgrpc.OTEL_EXPORTER_OTLP_ENDPOINTwith a value ofhttp://localhost:4317.
Sample
Section titled “Sample”For a sample of using the standalone dashboard, see the Standalone Aspire dashboard sample app.