


Aspire dashboard for local OpenTelemetry
Konten ini belum tersedia dalam bahasa Anda.
The Aspire dashboard is a local OpenTelemetry viewer for application logs, distributed traces, and metrics. Use it to follow requests across instrumented services, find errors, and inspect timing without leaving your development environment.
With an Aspire AppHost, the dashboard also shows resource state, health checks, console output, and configuration. You can use the standalone dashboard to receive telemetry without adopting Aspire orchestration.
Key features of the dashboard include:
- View structured logs, traces, and metrics from apps configured to export OpenTelemetry.
- Follow a distributed trace across local services and correlate its logs.
- Inspect resource health and stop, start, or restart resources when connected to an AppHost.
- Share application observability data with AI coding agents through the Aspire CLI or optional MCP server.
Use the dashboard with Aspire projects
Section titled “Use the dashboard with Aspire projects”The dashboard is integrated with TypeScript and C# AppHosts. During development, starting your AppHost launches the dashboard and configures its connection to your resources. Applications still need instrumentation and an OpenTelemetry exporter to send telemetry.
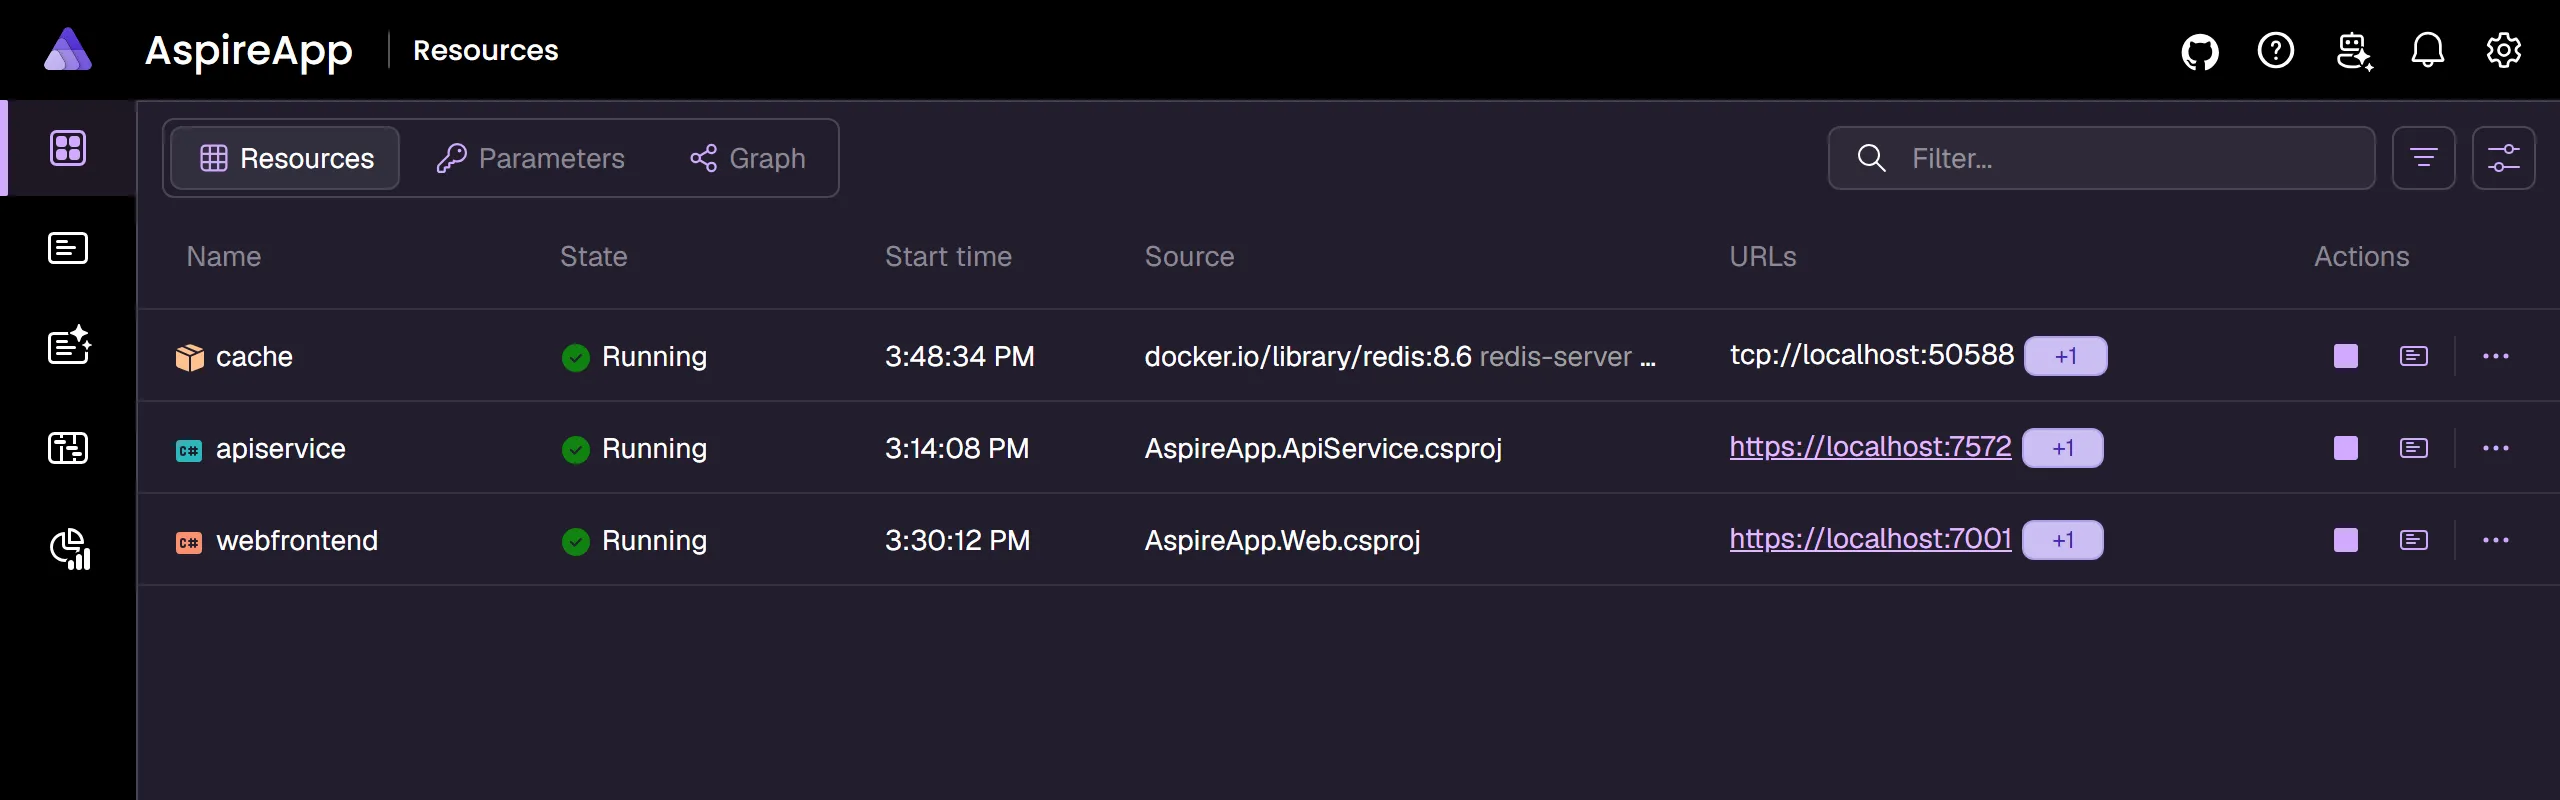
For more information about using the dashboard during Aspire development, see Explore dashboard features.
Standalone mode
Section titled “Standalone mode”The standalone dashboard is an OTLP viewer for any application configured to send OpenTelemetry data, including Python and JavaScript on Node.js. Start it with the Aspire CLI or a container image. Standalone mode doesn’t provide AppHost resource lifecycle controls; see Standalone Aspire dashboard for setup and limitations.
Configuration
Section titled “Configuration”The dashboard is configured when it starts up. Configuration includes frontend and OTLP addresses, the resource service endpoint, authentication, telemetry limits and more.
For more information, see Aspire dashboard configuration.
Architecture
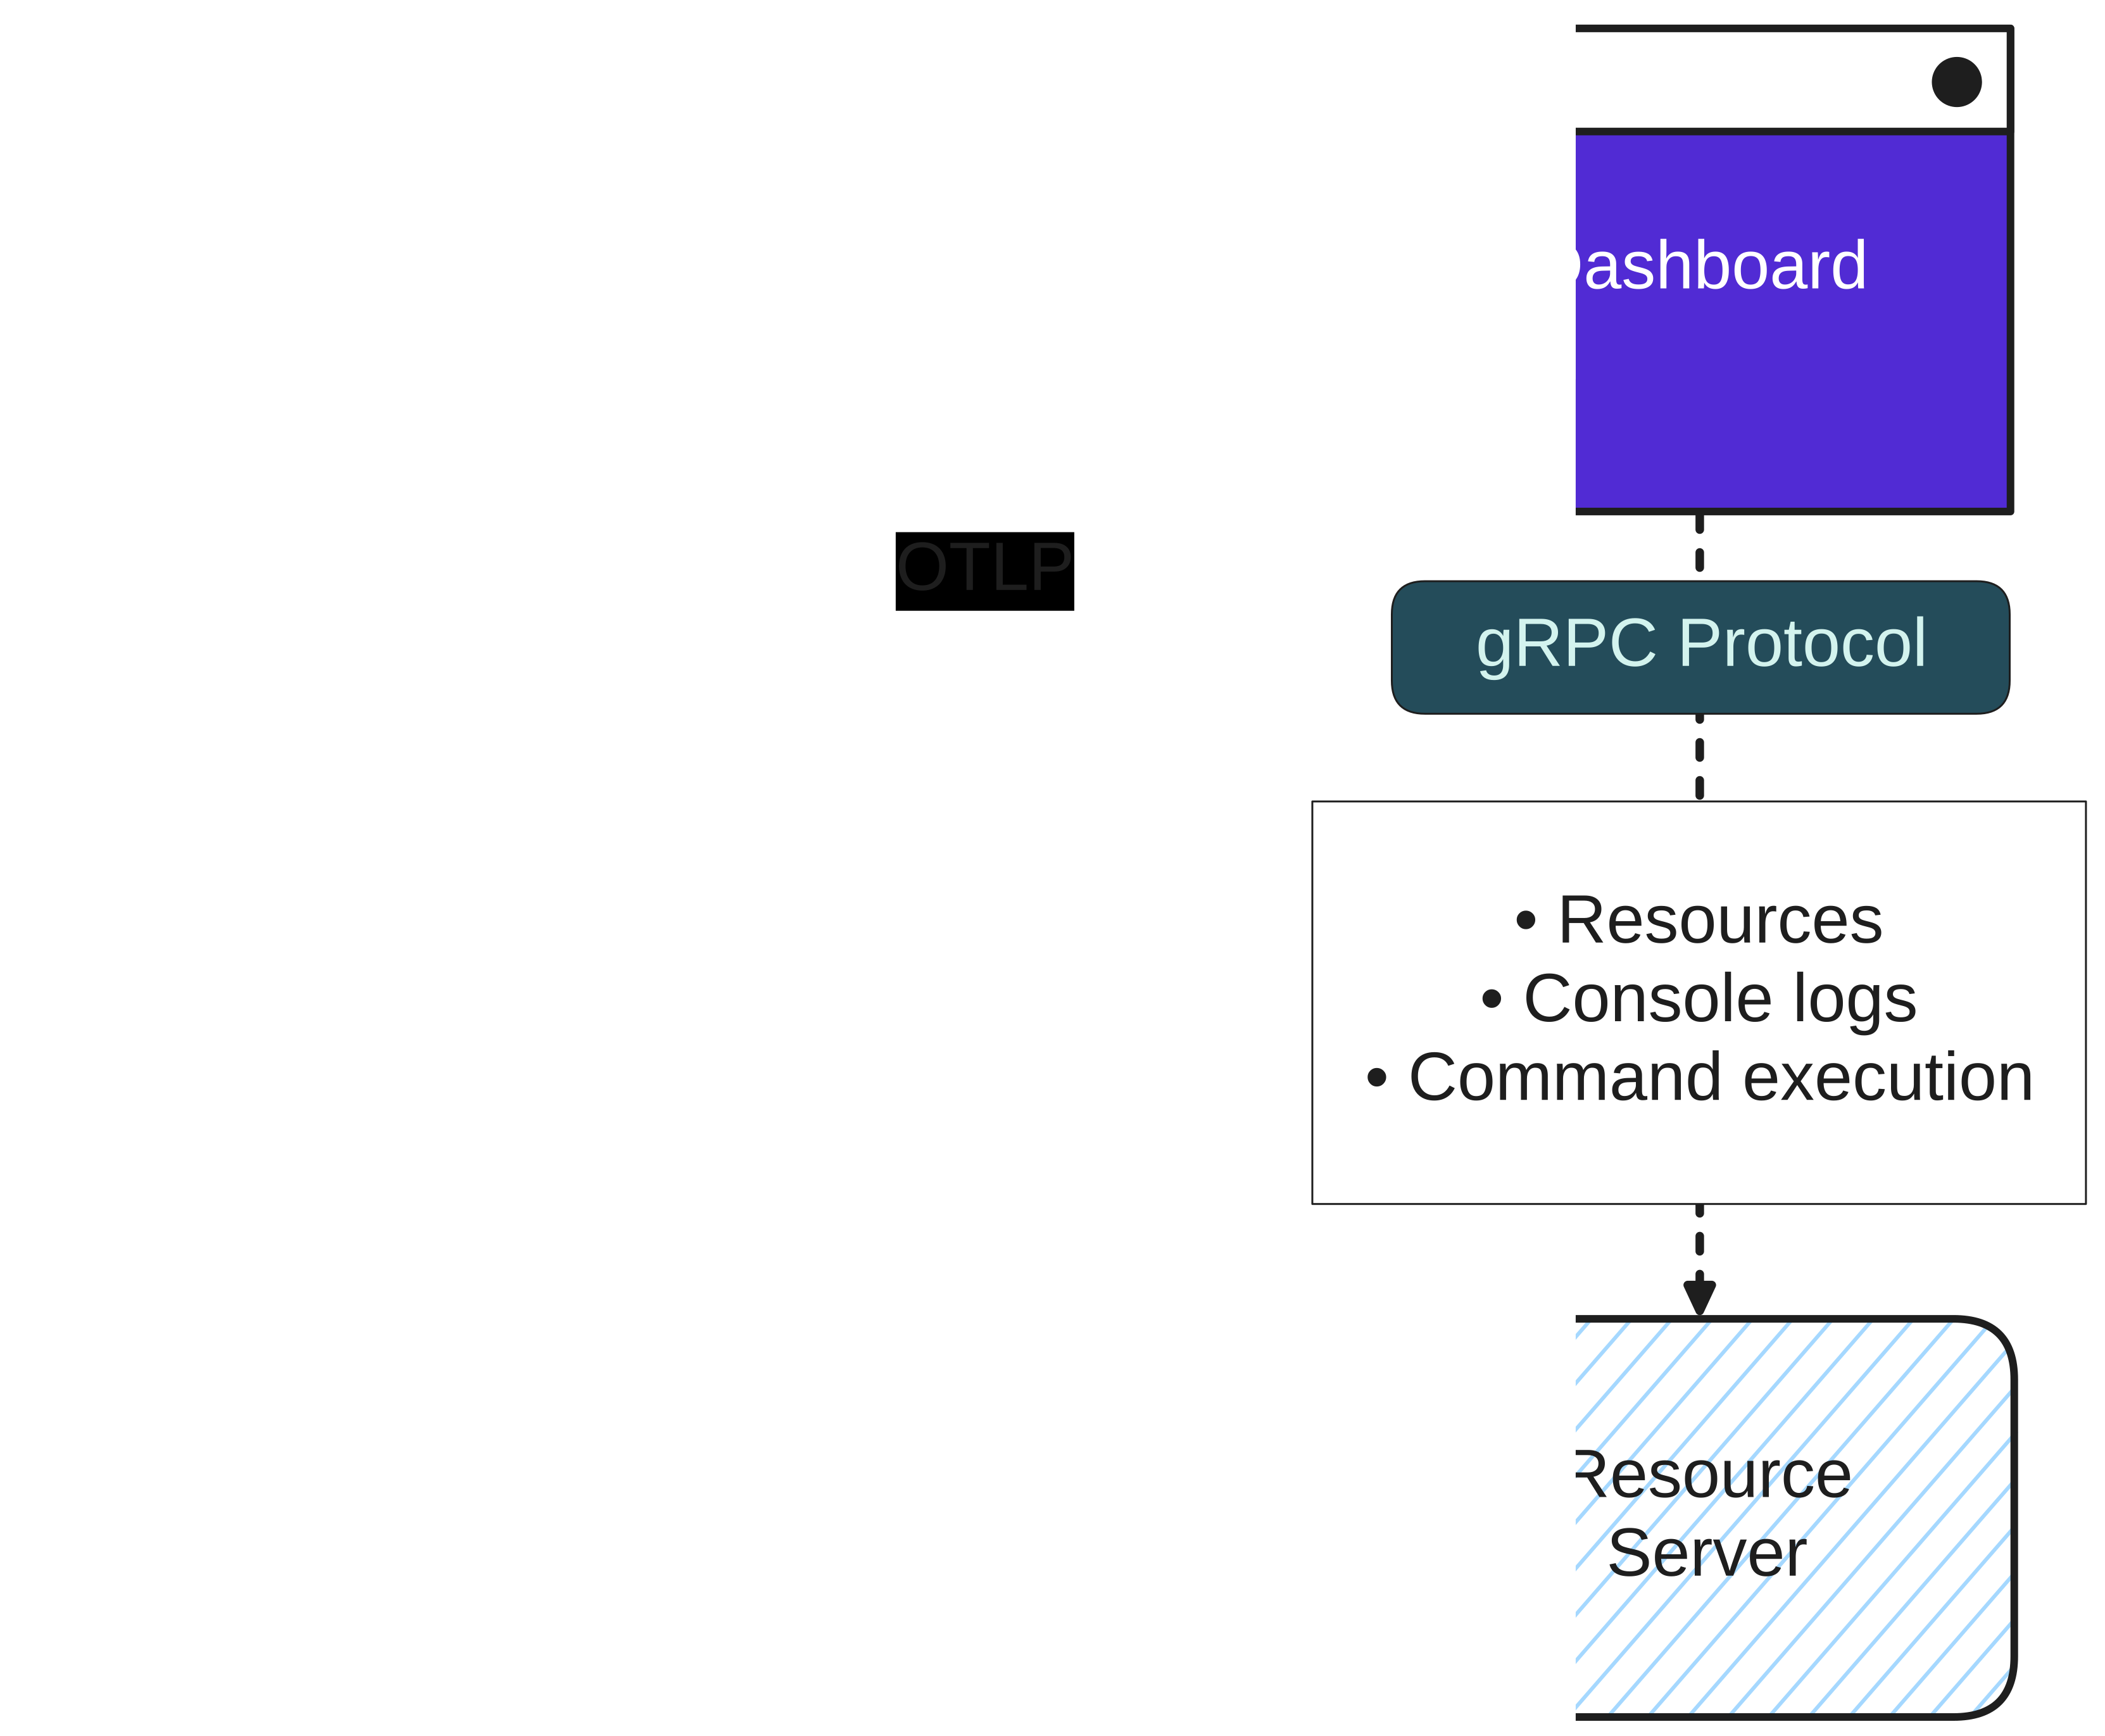
Section titled “Architecture”The dashboard user experience is built with a variety of technologies. The frontend communicates with the resource server over gRPC using the Grpc.AspNetCore NuGet package. Consider the following diagram that illustrates the architecture of the Aspire dashboard:
Security
Section titled “Security”The Aspire dashboard offers powerful insights to your apps. The UI displays information about resources, including their configuration, console logs and in-depth telemetry.
Data displayed in the dashboard can be sensitive. For example, configuration can include secrets in environment variables, and telemetry can include sensitive runtime data. Care should be taken to secure access to the dashboard.
For more information, see Aspire dashboard security considerations.
 Aspire